-
26 Aug, 2026
Why Can Two Publishers With the Same Traffic Earn Completely Different Revenue?
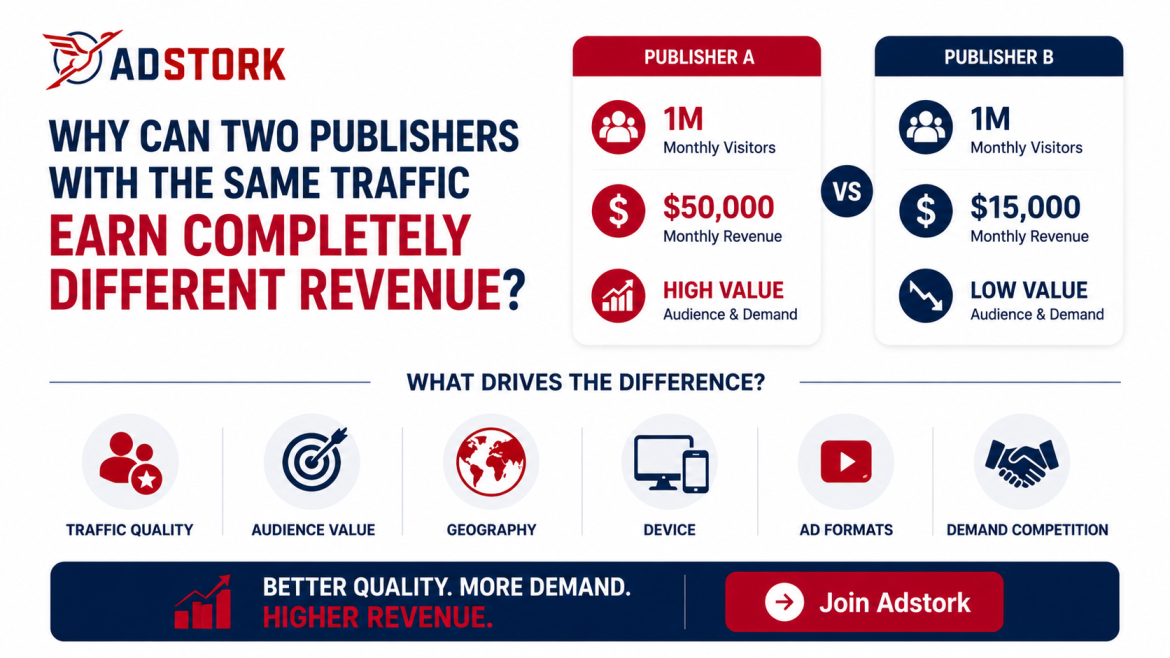
Publisher A and Publisher B both have 1 million monthly visitors. Same traffic volume. Same ad setup. Same basic metrics. But Publisher A earns $50,000 per month. Publisher B earns $15,000.What gives?This is the question that frustrates publishers everywhere. They look at the traffic numbers, compare them to competitors, and cannot understand why their revenue lags. The answer is not in the traffic volume. It is in the traffic quality, the audience value, and the advertiser demand that follows.Traffic is not a commodity. A million visitors to a finance site with engaged subscribers is not the same as a million visitors to a meme site with passive scrollers. Advertisers know the difference. They bid accordingly. The revenue gap reflects that difference.This guide explains the factors that separate high-earning publishers from low-earning ones, even when the traffic numbers look identical.Key TakeawaysSame traffic volume does not mean same revenue—quality, audience, and demand determine earnings.A publisher with 500,000 engaged, tier-1 visitors can earn 3-5x more than one with 500,000 passive, tier-3 visitors.Traffic quality (engagement, bounce rate, session duration) directly affects advertiser bids.Geographic composition is the largest structural factor in revenue differences.Monetization strategy—demand partners, ad formats, optimization—determines how much value you capture.Top earners combine strong traffic quality, high-value audiences, and competitive demand to maximize revenue.The Three Pillars of Revenue DifferenceThe revenue gap between two publishers with the same traffic comes down to three interconnected factors: traffic quality, audience value, and advertiser demand. Each builds on the others.Traffic quality determines whether visitors are actually engaged with your content or just passing through. Higher engagement means higher advertiser confidence and higher bids.Audience value determines what advertisers believe they can achieve with your audience. High-value audiences—those with purchase intent, loyalty, and strong demographics—command premium CPMs.Advertiser demand determines how many bidders compete for your inventory. More competition means higher bids. Less competition means lower bids. Your monetization strategy determines how much of that demand you capture.These three factors combine to create the revenue gap. Publishers who excel in all three earn multiples of those who ignore them.Neuromarketing insight: advertisers are not buying traffic. They are buying outcomes. An engaged, high-value audience signals that outcomes are achievable. A passive, low-value audience signals the opposite. The gap in perceived value creates the gap in actual revenue.1. Traffic QualityTraffic quality is the first differentiator. Two publishers with the same traffic volume can have dramatically different engagement metrics.Publisher A has visitors who stay for 3+ minutes, read multiple articles, and return regularly. Bounce rate is 45%. Publisher B has visitors who stay for 30 seconds, read one page, and rarely return. Bounce rate is 85%.Advertisers can see these differences. They analyze engagement signals and adjust bids accordingly. A visitor who stays 3 minutes is worth far more than a visitor who stays 30 seconds.The traffic source also matters. Organic search visitors who actively seek your content are more valuable than social media visitors who passively scroll past. Direct visitors who type your URL are more valuable than referral visitors from low-quality sources. Email subscribers are more valuable than one-time visitors.Publishers who build high-quality traffic through SEO, email, and direct navigation earn significantly more than those who rely on low-quality social or incentivized traffic.Revenue impact: High-quality traffic can command CPMs 2-5x higher than low-quality traffic.2. Audience ValueAudience value determines what advertisers believe they can achieve. It is the combination of demographics, purchase intent, and loyalty.Publisher A has a finance audience with high income, strong purchase intent, and active engagement. They research investments, compare products, and make decisions. Advertisers see high conversion potential. Publisher B has a general entertainment audience with low income, limited purchase intent, and passive consumption. Advertisers see low conversion potential.The difference is visible in the data. Advertisers use sophisticated tools to analyze audience composition, behavioral patterns, and engagement signals. They bid accordingly.Geography is a major component of audience value. US audiences command CPMs 3-5x higher than audiences from tier-3 countries. UK, Canadian, and Australian audiences are also premium. European audiences vary by country.Publishers who build high-value audiences through targeted content, community building, and audience development earn premium CPMs.Revenue impact: High-value audiences can command CPMs 3-10x higher than low-value audiences.3. Advertiser DemandAdvertiser demand determines how many bidders compete for your inventory and how much they are willing to pay. More competition means higher bids. Less competition means lower bids.Publisher A uses header bidding with five SSPs, creating real-time competition for every impression. Multiple bidders compete, driving CPMs higher. Publisher B uses a single SSP, with no competition. The single bidder sets the price, and it is lower.The difference is structural. More demand partners mean more competition, which means higher bids. It is that simple.Demand also varies by format, geography, and audience. Some SSPs specialize in certain geos or formats. Publishers who match their demand partners to their inventory see better fill rates and higher CPMs.Revenue impact: Multi-SSP header bidding can lift CPMs by 20-40% compared to single-SSP setups.Industry Insight: The Revenue Gap in NumbersThe gap between top-performing and average publishers is substantial. Analysis across publisher sites reveals clear patterns.Publishers with high traffic quality, tier-1 geos, and multi-SSP demand earn 3-5x more than those with low quality, tier-3 geos, and single-SSP setups. The difference is not theoretical—it is visible in real revenue numbers.A finance publisher with 500,000 engaged US visitors and five SSPs might earn $15-30 CPM. A meme publisher with 500,000 passive Indian visitors and one SSP might earn $0.50-1.50 CPM. Same traffic volume. 10-30x revenue difference.The data is clear. Traffic volume is not the revenue driver. Traffic quality, audience value, and demand competition are.The publishers who earn the most are not necessarily the ones with the most traffic. They are the ones with the best traffic, the most valuable audiences, and the most competitive demand.Closing the revenue gap requires addressing all three pillars. Adstork connects publishers to multiple premium demand sources through a unified header bidding platform, increasing competition and driving higher CPMs. Our reporting shows you exactly where your traffic quality, audience value, and demand competition stand compared to top performers. Explore Adstork's publisher solutions and see how better demand competition can close your revenue gap.Comparison Table: Two Publishers, Same Traffic, Different RevenueHere is a side-by-side comparison of two publishers with the same traffic volume but dramatically different revenue outcomes.FactorHigh-Earning PublisherLow-Earning PublisherMonthly Visitors1,000,0001,000,000Bounce Rate45%85%Avg. Session Duration3.5 minutes45 secondsGeographyUS, UK, Canada (80%)India, Southeast Asia (80%)Traffic SourceOrganic, Direct, EmailSocial, IncentivizedAd FormatVideo, Native, Premium DisplayStandard Display, PopundersViewability78%42%Demand Partners5 SSPs (Header Bidding)1 SSP (Waterfall)Average CPM$8.00$1.50Monthly Revenue$40,000$7,500Annual Revenue Gap—$390,000Same traffic volume. $390,000 annual revenue gap. The difference is not in the traffic count. It is in every factor that makes traffic valuable.Future Outlook: The Gap Will WidenThe revenue gap between high-earning and low-earning publishers is not shrinking. It is widening. Several trends are accelerating the divergence.Cookie deprecation is making audience quality more important. Publishers with strong first-party data and engaged audiences will thrive. Those with passive, low-value traffic will struggle.AI-powered bidding is making advertiser decisions more sophisticated. Bidders will increasingly reward high-quality inventory and punish low-quality inventory. The gap between the two will grow.Brand safety requirements are becoming stricter. Advertisers will increasingly avoid risky inventory. Publishers with clean, reputable content will capture premium demand.Supply scarcity is driving value toward premium inventory. As ad supply declines, the premium publishers will capture more of the available spend.The winners will be those who build high-quality traffic, high-value audiences, and competitive demand. The losers will be those who chase volume at the expense of quality.Two publishers with the same traffic volume can earn completely different revenue because of traffic quality, audience value, and advertiser demand.The difference is not in the traffic count. It is in every factor that makes traffic valuable. Publishers who optimise for quality, build high-value audiences, and create competitive demand earn multiples of those who focus only on volume.The gap is real, measurable, and growing. Understanding it is the first step to closing it.Adstork helps publishers close the revenue gap by connecting them to multiple premium demand sources, providing transparent reporting on traffic quality and audience value, and offering optimization tools that increase competitive pressure. Sign up for a free Adstork publisher account and get a complimentary revenue gap analysis that shows you exactly where you stand compared to top earners in your niche.Your immediate action plan: Audit your traffic quality, audience value, and demand competition. Compare your metrics to the high-earning publisher profile in this guide. Identify your biggest gap—is it engagement, geography, viewability, or demand partners? Address that gap first. Test one improvement over two weeks and measure the impact. Share your results with Adstork's optimization team for a personalized revenue growth plan.FAQsWhy do two publishers with the same traffic earn different revenue? Traffic volume is only one factor. Revenue depends on traffic quality (engagement, sources), audience value (geography, demographics, purchase intent), and advertiser demand (number of bidders, competition). A publisher with high-quality, tier-1 traffic and multiple demand partners earns far more than one with low-quality, tier-3 traffic and a single partner.How much can traffic quality affect revenue? Significantly. High-quality traffic with strong engagement can command CPMs 2-5x higher than low-quality traffic. The difference compounds across millions of impressions, creating revenue gaps of hundreds of thousands of dollars annually.What is the biggest factor in revenue differences? Geography is the largest structural factor. US traffic typically earns 3-5x more than tier-3 traffic. Combined with engagement and demand competition, the gap can be 10-30x between high-earning and low-earning publishers.How can I close the revenue gap? Address traffic quality by building engagement and clean sources. Build audience value by targeting high-value geos and demographics. Increase demand competition by adding SSPs through header bidding. Optimize viewability, formats, and technical performance. Each factor contributes to higher revenue.Does traffic volume matter at all? Yes, but only after quality and demand are optimized. A high-quality publisher with 100,000 visitors can earn more than a low-quality publisher with 1,000,000 visitors. Volume amplifies quality—it does not replace it.What is the revenue gap between top and average publishers? Analysis shows that top-performing publishers earn 3-5x more than average publishers with similar traffic volumes. In some cases, the gap can be 10-30x when comparing the best and worst performers.
Read More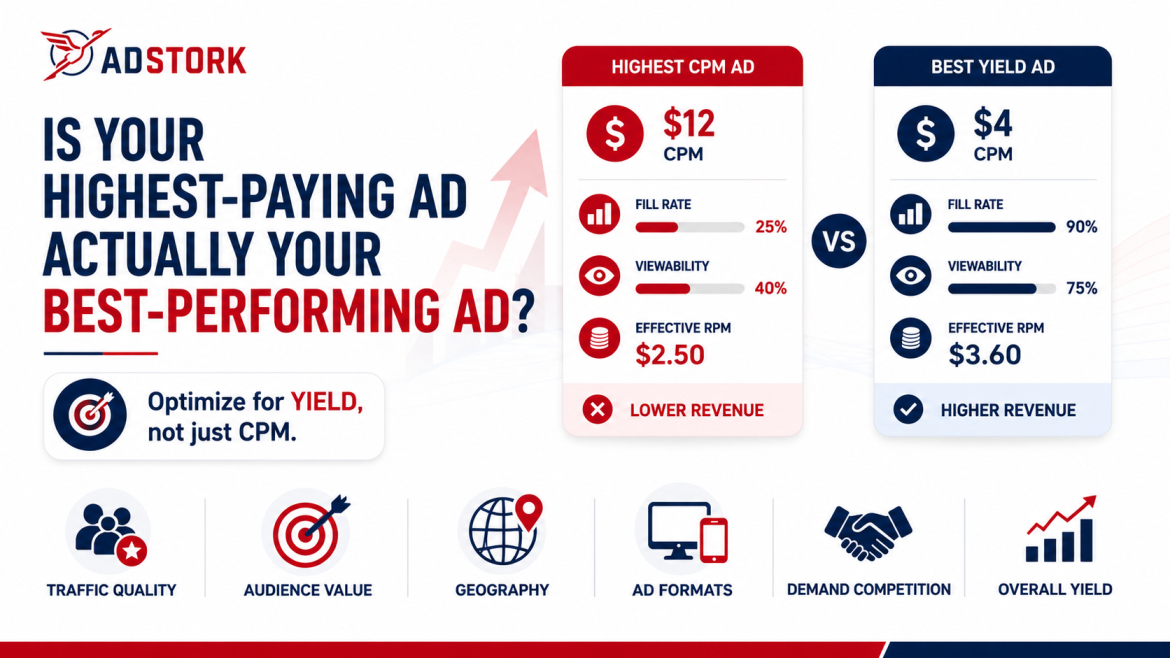
-
26 Aug, 2026
Is Your Highest-Paying Ad Actually Your Best-Performing Ad?
Your dashboard shows one ad unit earning a $12 CPM. You celebrate. You tell your team. You consider shifting all your inventory to that format.Then you look at your total revenue. It is not moving the way you expected. The headline number looks great. The bottom line does not.What happened? You confused the highest-paying ad with the best-performing ad. They are not the same thing.A high CPM ad might look impressive, but it could be cannibalising other revenue streams, reducing fill rates, degrading user experience, or damaging long-term value. The best-performing ad is the one that maximizes your overall yield, not just the individual bid.This guide explains why the highest-paying ad is often not the best-performing ad, what true yield optimization looks like, and how to evaluate your ad stack for overall performance.Key TakeawaysThe ad with the highest CPM is not always your best performer, overall yield is what matters.A $10 CPM ad at 20% fill generates less revenue than a $4 CPM ad at 90% fill.High-CPM ads often cannibalise demand from other units, reducing total revenue.Viewability, user experience, and impact on adjacent inventory affect overall yield.Publishers who optimize for yield—not individual CPM—consistently earn more.The High CPM Trap, RevisitedThe high CPM trap is one of the most persistent misconceptions in publisher monetization. A single ad unit shows a high CPM, and you assume it is your best performer. But CPM is only part of the story.Consider this scenario. Ad Unit A has a $10 CPM but only fills 25% of requests. Ad Unit B has a $4 CPM and fills 90% of requests. Ad Unit A generates $2.50 per 1,000 requests. Ad Unit B generates $3.60 per 1,000 requests. The lower CPM unit is the better performer.Now add viewability. Ad Unit A has 40% viewability. Ad Unit B has 75% viewability. The effective value of Unit A drops further. Advertisers pay premiums for viewable inventory, and low viewability reduces demand over time.The high CPM trap is seductive because it focuses on a single, visible number. But that number does not tell you what you actually earn.Neuromarketing insight: salience bias makes us focus on the most noticeable number. A $12 CPM stands out. A 90% fill rate does not. But the fill rate determines whether you actually see that $12. Publishers who overcome this bias and focus on yield consistently outperform those who chase headline CPMs.The Truth About YieldYield is the total revenue you generate from your inventory. It is the combination of fill rate, CPM, and revenue per session. Optimising for yield requires looking beyond individual ad units to the overall performance of your ad stack.The highest-paying ad might be hurting your overall yield in several ways.1. Cannibalisation. A high-CPM unit might be stealing demand from other units. If you have one premium unit that captures all the high-value demand and leaves lower-value demand for other units, your total revenue might be lower than if you spread demand more evenly.2. Fill rate trade-offs. High CPM units often have lower fill rates. The high price scares off some buyers, leaving impressions unfilled. A moderate CPM unit with higher fill might generate more total revenue.3. Viewability penalties. Some high-CPM units have poor viewability. Advertisers see this and reduce bids over time. The unit might look good today but degrade in value.4. User experience damage. Aggressive high-CPM units often degrade user experience. High ad density, intrusive formats, or slow-loading creatives drive users away. Lower session duration and higher bounce rates reduce long-term revenue.5. Long-term audience value. The best-performing ad is the one that balances short-term revenue with long-term audience retention. A high-CPM unit that drives users away might earn more today but reduce earnings tomorrow.Industry Insight: The Yield Gap in PracticeAnalysis across publisher sites reveals a significant gap between headline CPM and actual yield. Publishers who optimise for yield outperform those who chase high CPMs.A publisher with a $6 average CPM but 85% fill rate and strong viewability might earn more than a publisher with a $10 CPM but 55% fill rate and weak viewability. The gap is visible in total revenue, not in headline numbers.The most successful publishers use multiple formats and demand sources, balancing high-CPM units with high-fill units. They prioritise overall yield over individual unit performance. They understand that the best-performing ad is the one that contributes to total revenue, not the one with the highest single bid.This is particularly true with header bidding. Publishers with 3-5 SSPs see higher overall yields because competition drives up bids across all units, not just the premium ones. The aggregate effect is more important than any single bid.The takeaway is clear: chasing the highest CPM is a losing strategy. Optimising for yield is the winning approach.Optimising for yield requires visibility into your entire ad stack—not just individual CPMs. Adstork provides transparent reporting that shows fill rate, viewability, and revenue per session for each ad unit and demand partner. You can see which units are truly performing and which are just chasing headline numbers. Explore Adstork's reporting tools and start optimising for yield, not vanity metrics.Comparison Table: Highest CPM vs. Best YieldHere is how a publisher chasing the highest CPM compares to one optimising for overall yield.MetricChasing Highest CPMOptimising for YieldHighest Unit CPM$12.00$8.00Overall CPM$4.50$6.00Fill Rate55%85%Viewability45%72%Revenue Per Session$0.08$0.14Monthly Revenue (1M requests)$4,500$6,000User ExperiencePoor (intrusive units)Good (balanced approach)Long-Term SustainabilityWeak (drives users away)Strong (retains audience)The publisher optimising for yield earns 33% more revenue, has better viewability, and preserves user experience. The headline CPM is lower. The total revenue is higher.Future Outlook: Yield Optimisation in 2026 and BeyondThe future of publisher monetisation is yield optimisation, not CPM chasing. Several trends are reinforcing this shift.AI-powered optimisation is making yield optimisation more sophisticated. Machine learning models analyse the entire ad stack, adjusting floor prices, demand routing, and ad placement to maximise overall yield.Unified measurement is becoming the standard. Publishers are moving away from fragmented dashboards and toward unified platforms that show the complete picture—fill rate, CPM, viewability, and revenue per session, all in one place.User experience focus is intensifying. Publishers who prioritise user experience are seeing better long-term retention and higher lifetime value. Intrusive, high-CPM units that degrade experience are becoming less viable.Privacy regulations are making audience quality more important. Publishers who build trust and engagement with their audiences will command premium yields.The publishers who thrive will be those who optimise for yield, not CPM. They will balance multiple formats, demand sources, and user experience considerations. They will understand that the highest-paying ad is rarely the best-performing ad.The highest-paying ad is rarely your best-performing ad. The ad with the highest CPM might look impressive, but it could be cannibalising other revenue streams, reducing fill rates, degrading user experience, or damaging long-term value.The best-performing ad is the one that maximises your overall yield—the combination of fill rate, CPM, viewability, and revenue per session. Publishers who optimise for yield consistently earn more than those who chase headline CPMs.Adstork helps publishers optimise for yield with transparent reporting, multi-SSP demand, and optimisation tools that show you the complete picture. Sign up for a free Adstork publisher account and get a complimentary yield analysis that shows you exactly where you are leaving revenue on the table.Your immediate action plan: Audit your ad stack. Identify your highest-CPM unit. Compare its effective RPM and revenue per session to your other units. Is it actually generating the most revenue? If not, investigate why. Is it cannibalising demand? Hurting viewability of other units? Degrading user experience? Adjust accordingly. Test the impact over two weeks. Share your results with Adstork's optimisation team for a personalised yield improvement plan.Frequently Asked QuestionsWhy isn't the highest-paying ad my best-performing ad? Because CPM only shows what an advertiser agrees to pay, not what you actually earn. A high CPM unit might have low fill rate, poor viewability, or cannibalise demand from other units. The best-performing ad is the one that maximises your overall yield.What is yield optimisation? Yield optimisation is the practice of maximising total revenue from your inventory by balancing fill rate, CPM, viewability, demand diversity, and user experience. It looks beyond individual unit performance to overall revenue outcomes.How do I know if a high-CPM unit is hurting my yield? Look at its impact on adjacent units. Is it capturing demand that would otherwise go to other units? Does it have low fill rate or viewability? Is it degrading user experience? These factors reduce overall yield even when CPM is high.What metrics should I track instead of CPM? Track effective RPM (CPM × Fill Rate), revenue per session, overall fill rate, and viewability. These metrics give you a complete picture of your monetisation performance. Individual CPM is only one piece of the puzzle.Can a lower CPM unit outperform a higher CPM unit? Yes. A $4 CPM unit with 90% fill and strong viewability often outperforms a $10 CPM unit with 25% fill and poor viewability. The lower CPM unit generates more total revenue.How do I optimise for overall yield? Start by measuring your yield across all units and demand partners. Identify underperforming segments. Test adjustments—adding demand partners, changing floor prices, adjusting ad placement and measure the impact on overall revenue. Prioritise balance over individual unit performance.
Read More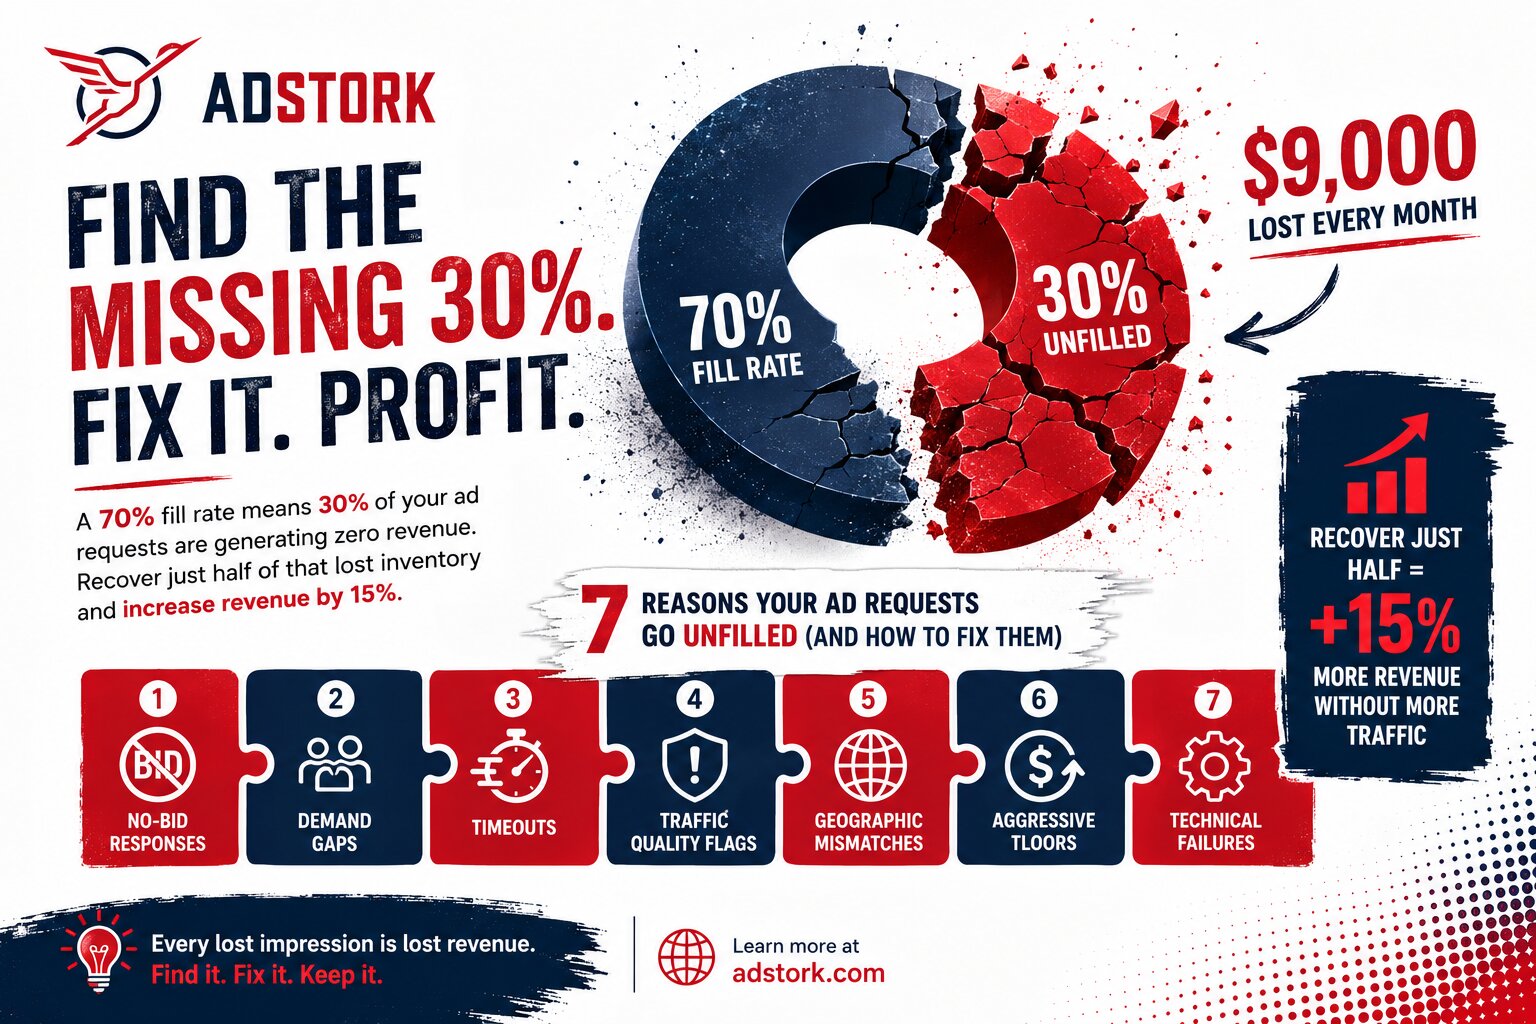
-
24 Aug, 2026
Your Fill Rate Is 70%. So Where Did the Other 30% Go?
Your dashboard shows a 70% fill rate. You think that is good. After all, 70% is a passing grade in most things.But here is the uncomfortable truth: 70% fill means 30% of your ad requests are generating zero revenue. On 10 million monthly requests at a $3 CPM, that is $9,000 in lost revenue every single month. Over a year, that is $108,000 disappearing into thin air.The missing 30% did not just vanish. It is hiding in plain sight, scattered across seven common causes. Each one is identifiable. Each one is fixable. And recovering just half of that lost 30% can increase your revenue by 15% without a single additional visitor.This guide shows you exactly where that missing 30% went—and how to get it back.Key TakeawaysA 70% fill rate means 30% of your ad requests are unfilled—recovering just half of that lost inventory increases revenue by 15%.The missing 30% comes from seven common causes: no-bid responses, demand gaps, timeouts, traffic quality flags, geographic mismatches, aggressive floors, and technical failures.Each cause has a specific fix: adding demand partners, adjusting floors, improving technical performance, or addressing traffic quality.No-bid responses are often the biggest contributor to unfilled requests.Understanding why your fill rate is 70% is the first step toward making it 85% or 90%.The Anatomy of an Unfilled Ad RequestEvery time a page loads on your site, your ad server sends a request to demand partners asking for an ad. In a perfect world, every request returns a bid and fills. But the world is not perfect.An unfilled request is simply a request that did not result in an ad being served. The reasons fall into seven categories, each representing a different leak in your monetisation funnel.Think of it like a retail store with empty shelves. The customers are there, the foot traffic is solid, but 30% of the shelves are bare. Why? Maybe the supplier is out of stock. Maybe the delivery is late. Maybe the price is too high. Maybe the shelves are hard to reach. The causes vary, but the outcome is the same: lost sales.Neuromarketing insight: unfilled requests are invisible by nature. You see the filled impressions and the revenue they generate, but you do not see what you missed. The brain treats invisible losses differently than visible ones. This is loss aversion bias. Publishers who ignore unfilled requests are unconsciously accepting losses they would never tolerate if those losses were visible. Making the invisible visible is the first step to fixing it.1. No-Bid ResponsesThis is the most common cause of unfilled requests. A demand partner receives your request, evaluates the impression, and decides not to bid.Why does this happen? Sometimes the bidder does not have an active campaign that matches your audience. Sometimes the buyer has spent their budget for the day. Sometimes the impression does not meet their targeting criteria.No-bid responses are a signal that your demand sources are not fully aligned with your inventory. If many partners are saying "no bid," you may need to diversify your demand stack or improve your audience appeal.Fix: Add complementary demand partners. A publisher with one SSP might have no-bid rates of 30-40%. With three to five SSPs, no-bid rates often drop below 10% because more buyers are competing for each impression.2. Demand Availability GapsNot all ad formats, devices, or geographies have equal demand. If you are running a format that few buyers support, fill rates will suffer.For example, video ads typically have higher fill rates than rich media formats because more buyers support video. Native ad fill rates vary dramatically by network. Mobile web interstitials often have strong fill, but rewarded video can be more limited.Demand availability gaps are also seasonal and cyclical. During major shopping periods like Q4, demand is abundant across most formats. During slower months, certain formats and geographies may see fill rates drop.Fix: Diversify your formats. If your site relies heavily on a format with limited demand, test other formats. A mix of display, native, and video can smooth out demand gaps across formats.3. TimeoutsEvery ad request has a timeout window, typically 1-2 seconds. If a demand partner does not respond within that window, the request is considered unfilled.Timeouts are a technical issue. They happen when the bidder's servers are slow, when network latency is high, or when the page is overloaded with too many simultaneous requests. Timeouts are more common on mobile devices, where latency is naturally higher.Publishers using client-side header bidding with multiple partners often experience higher timeout rates because the browser is making many concurrent calls. Server-side header bidding reduces timeout rates by moving the auction to a server with better connectivity.Fix: Migrate to server-side header bidding. Reduce the number of partners in your client-side setup. Optimise page load speed to give more time for ad requests. Adjust timeout settings based on your specific technical environment.4. Traffic Quality FlagsDemand partners filter out traffic they consider low quality or suspicious. If your traffic is flagged, you will see a higher percentage of no-bid responses or filtered impressions.Common red flags include high bounce rates, short session durations, suspicious referral sources, sudden traffic spikes, and geographic anomalies. Advertisers want to reach real humans with genuine engagement potential. Traffic that looks automated, incentivised, or low-intent gets less demand.This creates a vicious cycle: low-quality traffic gets less demand, which reduces fill rate, which reduces revenue, which incentivises volume over quality, which creates more low-quality traffic.Fix: Audit your traffic sources. Cut low-quality sources that trigger flags. Focus on building high-engagement audiences through quality content and legitimate acquisition channels. Clean traffic attracts better demand and higher fill rates.5. Geographic Demand MismatchesAdvertiser demand varies dramatically by geography. Tier-1 countries like the US, UK, Canada, and Australia have abundant demand and high fill rates. Tier-2 and tier-3 countries often have limited demand and lower fill.If your traffic is heavily concentrated in countries with low advertiser demand, your fill rate will reflect that. A publisher with 80% US traffic might see 85% fill. A publisher with 80% Indian traffic might see 50% fill.The gap is not your fault, but it is your problem. Demand partners simply have fewer campaigns targeting those regions.Fix: Add demand partners with stronger coverage in your geos. Some SSPs specialise in tier-2 and tier-3 markets. Test different partners to find the ones that fill your specific geos best. Accept that geography sets a ceiling on your fill rate and focus on optimising within that constraint.6. Overly Aggressive Floor PricesFloor prices protect you from low bids, but setting them too high can kill competition and reduce fill. If buyers typically bid around $1.50 and your floor is $2.50, you are rejecting demand that could have generated meaningful revenue.Publishers with aggressive floors run at roughly half the fill rate of right-sized competitors. They charge nearly 2x the CPM per impression and still generate 18% less revenue per session.This is the floor price trap. You chase higher CPMs, set floors too high, kill fill, and end up earning less overall.Fix: Test floors systematically. Run controlled tests at different floor levels and measure total revenue, not just CPM. A slightly lower floor that fills 20% more inventory often produces higher overall earnings. Test floors by GEO, device, and format, not globally.7. Technical IssuesSometimes the problem is technical. The ad tag is misconfigured. The page is loading too slowly. The ad server is having trouble. The browser is blocking the request.Technical issues are often invisible. You might see a filled impression in your dashboard that never actually rendered on the page. You might see a timeout error that you assume is normal.Common technical issues include ad tag placement errors, JavaScript conflicts, slow page load times, mobile rendering problems, and ad blocker interference.Fix: Audit your technical setup. Check ad tag placement, page speed, and mobile performance. Use ad verification tools to ensure ads are actually rendering. Optimise Core Web Vitals to reduce load times. Consider server-side header bidding to reduce browser-side failures.Diagnosing where your 30% went requires a unified view of your monetisation performance. Adstork provides transparent, real-time reporting that breaks down unfilled requests by cause no-bid responses, timeouts, traffic quality flags, and more. You can see exactly which segment is underperforming and take targeted action. Explore Adstork's publisher reporting tools and start recovering your lost revenue today.Industry Insight: What the 2026 Data ShowsThe causes of unfilled requests are not equally distributed. Analysis across publisher sites reveals clear patterns.No-bid responses are the largest contributor, accounting for 40-60% of unfilled requests. This is where adding demand partners has the biggest impact. Each additional SSP can reduce no-bid rates by 5-10%.Timeouts account for 15-25% of unfilled requests, especially on mobile devices and in slower geographies. Server-side header bidding can reduce timeout rates by 50-70%.Traffic quality flags affect 10-20% of requests on sites with mixed traffic sources. Clean traffic sources see flag rates below 5%.Geographic mismatches determine the baseline fill rate. Publishers in tier-1 geos often start with 80%+ fill, while tier-2/3 publishers start at 40-60%.The takeaway is clear: you need to know your specific breakdown before you can fix it. A publisher with mostly no-bid responses needs demand diversity. A publisher with mostly timeouts needs technical optimisation. A publisher with traffic quality flags needs cleaner sources.Comparison Table: Fill Rate Causes and SolutionsHere is a quick reference guide to the seven causes of unfilled requests and how to fix them.CauseTypical ImpactSolutionNo-Bid Responses40-60% of unfilledAdd complementary demand partnersDemand Gaps10-20% of unfilledDiversify formats, add format-specific partnersTimeouts15-25% of unfilledServer-side header bidding, faster page loadsTraffic Quality Flags10-20% of unfilledAudit and clean traffic sourcesGeographic Mismatches5-15% of unfilledPartners with better regional coverageAggressive Floors5-10% of unfilledTest floors, measure total revenueTechnical Issues5-10% of unfilledAudit setup, optimise Core Web VitalsFuture Outlook: Closing the Fill Rate GapThe future of fill rate optimisation is about intelligence and automation. Publishers who rely on manual diagnosis will fall behind those who use data-driven tools.AI-powered diagnosis is emerging as a key tool. Machine learning models can analyse unfilled requests and identify patterns faster than humans can. They can tell you that your no-bid rate spikes at 2 PM every Tuesday, or that timeouts are 3x higher on mobile devices in Southeast Asia.Automated floor optimisation is reducing the floor price trap. Dynamic floors adjust in real time based on fill rate and CPM, finding the balance that maximises total revenue.Unified demand management is replacing the fragmented approach. Instead of managing multiple SSPs separately, publishers are using unified wrappers that route traffic intelligently to maximise fill and revenue.The gap between 70% and 85% fill is significant. It is the difference between stable revenue and revenue that consistently leaves money on the table. Publishers who understand where their 30% went and take action to recover it will build more sustainable businesses.Your fill rate is 70%. That is not a passing grade. It is a signal that 30% of your revenue potential is leaking away.The missing 30% is hiding in no-bid responses, demand gaps, timeouts, traffic quality flags, geographic mismatches, aggressive floors, and technical issues. Each cause is identifiable. Each is fixable. And recovering just half of that lost 30% can increase your revenue by 15% without a single additional visitor.Adstork helps publishers diagnose and fix fill rate issues with transparent reporting, multi-SSP demand, and optimisation tools. Our platform shows you exactly where your unfilled requests are going and provides the infrastructure to close those gaps. Sign up for a free Adstork publisher account and get a complimentary fill rate diagnosis that shows you exactly where your 30% is going and how to get it back.Your immediate action plan: Pull your last 30 days of reporting and segment unfilled requests by cause. Identify your biggest contributor, is it no-bid responses, timeouts, traffic quality, or something else? Focus on fixing that one cause first. Test one solution like adding a demand partner or adjusting floors and measure the impact over two weeks. Share your results with Adstork's optimisation team for a personalised improvement plan.FAQsWhy is my fill rate 70% and not higher? A 70% fill rate means 30% of your ad requests are unfilled. The most common causes are no-bid responses (when demand partners choose not to bid), timeouts (when requests take too long), traffic quality flags, geographic demand mismatches, aggressive floor prices, and technical issues.What is a no-bid response? A no-bid response occurs when a demand partner receives your ad request but decides not to submit a bid. This can happen if they do not have an active campaign matching your audience, if they have spent their budget, or if the impression does not meet their targeting criteria.How do timeouts affect fill rate? Timeouts happen when a demand partner does not respond within the allowed time window, typically 1-2 seconds. This is more common with client-side header bidding and on mobile devices. Timeouts can be reduced by migrating to server-side header bidding.Can aggressive floor prices reduce fill rate? Yes. Setting floor prices too high can kill competition and reduce fill. If buyers typically bid around $1.50 and your floor is $2.50, you are rejecting demand. Test floors at different levels and measure total revenue, not just CPM.How does geography affect fill rate? Advertiser demand varies by geography. Tier-1 countries like the US, UK, and Canada have high demand and high fill rates. Tier-2 and tier-3 countries have lower demand and lower fill rates. This creates a baseline fill rate that is difficult to exceed without regional demand partners.What is a good fill rate to aim for? Top-performing publishers achieve 85-95% fill rates using header bidding with multiple demand partners. Most well-optimised publishers land between 80% and 90%. Below 80% means you are likely leaving significant revenue on the table.
Read More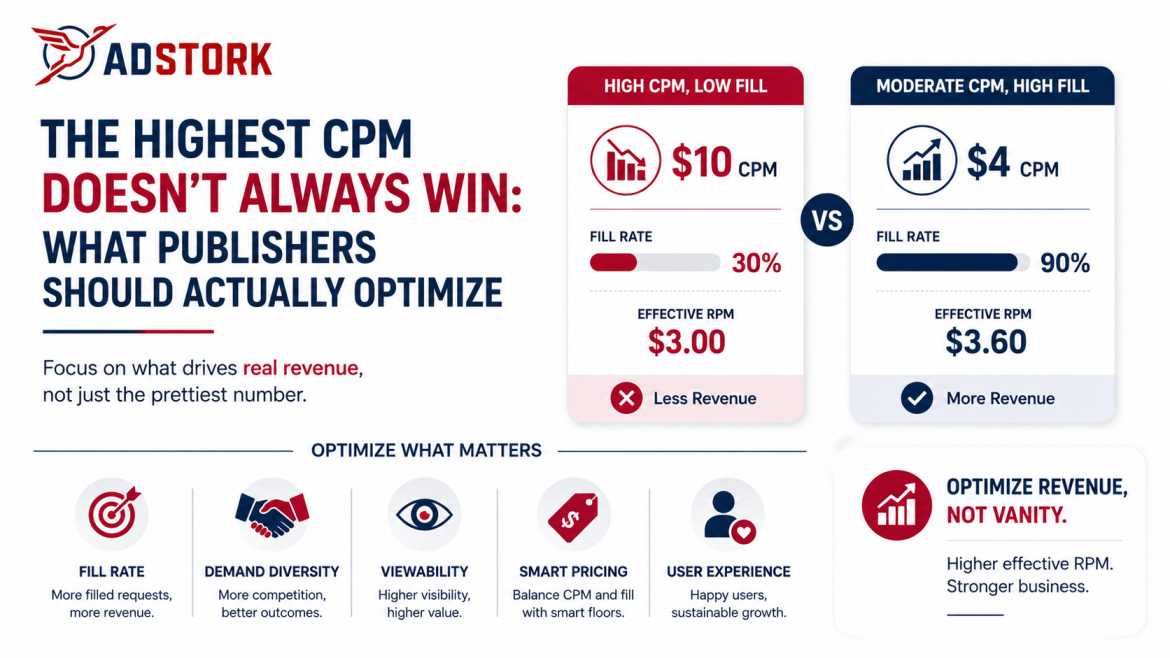
-
24 Aug, 2026
The Highest CPM Doesn't Always Win: What Publishers Should Actually Optimize
Your dashboard shows a $10 CPM. You feel good. The number is impressive. Your colleagues are impressed. You are winning.Then you look at your actual revenue. It is not matching the excitement.What happened? You were optimizing the wrong number.CPM is the advertiser's metric. It tells you what they agree to pay. But what you actually earn is a different story entirely. A high CPM with low fill, low viewability, and poor engagement will almost always underperform a moderate CPM with strong fundamentals.This is the trap that catches publishers every day. They chase the dashboard's prettiest number while ignoring the revenue outcome. This guide explains why the highest CPM doesn't always win, what you should actually optimize, and how to build a monetization strategy that prioritizes revenue, not vanity.Key Takeaways:• The highest CPM doesn't always win a $10 CPM at 30% fill earns less than a $4 CPM at 90% fill.• CPM is an advertiser metric. Effective RPM is a publisher metric. They are not the same.• Optimize for revenue per 1,000 requests (effective RPM), not the dashboard's prettiest number.• Fill rate, viewability, demand diversity, and user experience all affect your actual earnings more than headline CPM.• Publishers who optimize for revenue outcomes consistently outperform those who chase vanity metrics.The High CPM TrapHere is the math that every publisher should internalize:Publisher A: $10 CPM, 30% fill rate = $3.00 effective RPMPublisher B: $4 CPM, 90% fill rate = $3.60 effective RPMPublisher B has the lower headline CPM but earns more revenue. The $10 CPM looks better. But it is a lie.Now add revenue share. If your network takes 30%, Publisher A's net effective RPM drops to $2.10. Publisher B's drops to $2.52. The gap widens.Add viewability. If Publisher A's ads are 40% viewable and Publisher B's are 80% viewable, the real value gap grows even larger. Advertisers pay premiums for viewable inventory, and unviewable impressions generate less demand over time.The high CPM trap is seductive because it appeals to our ego. We want to show the big number. We want to feel successful. But the big number often comes at the expense of fill rate, demand diversity, and long-term revenue stability.Neuromarketing insight: the human brain fixates on the highest visible number. This is salience bias, we focus on what stands out, not what matters. CPM stands out because it is a single, impressive number. Effective RPM requires mental math. Publishers who overcome this bias and track the right metrics consistently outperform those who chase headlines.What to Optimize Instead of CPMIf CPM is the wrong number to optimize, what should you focus on? The answer is effective RPM (revenue per 1,000 requests). But effective RPM is not a single lever. It is the outcome of several interconnected factors.1. Fill rate. The percentage of ad requests that actually receive an ad. This is the most direct lever for increasing revenue. A 10% increase in fill rate is a 10% increase in revenue, assuming all else stays equal. Fill rate is often easier to improve than CPM, add demand partners, adjust floors, and optimize technical performance.2. Demand diversity. The number and quality of demand sources competing for your inventory. More competition drives higher CPMs and better fill rates. Header bidding with multiple SSPs consistently outperforms single-source setups. Publishers using 3-5 demand partners see 20-40% revenue lifts compared to single-source configurations.3. Viewability. The percentage of impressions that are actually seen by users. Viewable inventory commands higher CPMs. Above 80% viewability, buyers stop differentiating on viewability scores and start differentiating on fill rate, inventory volume, and audience quality.4. Floor pricing. Dynamic floor pricing that balances fill rate and CPM. Static floors often sacrifice fill for CPM. Dynamic floors adjusted via real-time yield data capture 15%+ RPM uplift without traffic growth.5. User experience. The quality of your site experience affects everything. Slow pages reduce fill. Poor mobile experiences reduce demand. High ad density drives users away. Publishers who maintain clean, fast, user-friendly sites consistently earn higher effective RPMs.The right approach is to optimize all of these factors together. Chasing a single number—even CPM—will always produce suboptimal results.The Math of Effective RPMEffective RPM is the only number that captures your actual earnings per 1,000 requests. It combines fill rate and CPM into a single, meaningful metric.Effective RPM = CPM × Fill RateHere is how different publishers compare at the same traffic volume (1 million monthly requests):PublisherCPMFill RateEffective RPMMonthly RevenueA$10.0030%$3.00$3,000B$6.0070%$4.20$4,200C$4.0090%$3.60$3,600D$2.5095%$2.38$2,375Publisher B has the highest revenue, not the highest CPM. Publisher A has the highest CPM but the lowest revenue. This is the trap in action.Effective RPM also makes it easy to compare across formats and demand partners. A display ad with a $5 CPM and 70% fill generates the same effective RPM as a native ad with a $7 CPM and 50% fill. Without effective RPM, you would compare the $5 and $7 numbers and miss the reality.Industry Insight: The Data Speaks for ItselfThe data tells a clear story. Publishers who optimize for effective RPM consistently outperform those who chase high CPMs.Analysis across publisher sites shows that the top-performing publishers by revenue are rarely the ones with the highest headline CPMs. They are the ones with the best balance of fill rate, demand diversity, viewability, and user experience.Publishers who added demand partners and improved fill rates saw revenue lifts of 20-40%, even when their average CPMs dropped slightly. Publishers who chased high CPMs at the expense of fill rates often saw total revenue decline.The gap is widening. As programmatic auctions become more sophisticated, the value of diversified demand and high fill rates is increasing. Publishers who optimize for the right metrics will capture this value. Those who chase vanity metrics will fall behind.A recent industry analysis found that publishers who use header bidding with 3-5 SSPs achieve 20-40% revenue uplifts compared to single-source configurations. The revenue uplift is driven by better fill rates and higher competitive pressure, not just headline CPM.Optimizing for revenue outcome requires a unified view of your monetization performance. Adstork connects publishers to multiple premium demand sources through a single header bidding platform, driving real-time competition that improves fill rates and effective RPM simultaneously. Our reporting shows you the metrics that actually matter effective RPM, revenue per session, and fill rate by segment—so you can optimize for revenue, not vanity. Explore Adstork's publisher solutions and see how better optimization transforms your revenue.Comparison Table: Vanity Metrics vs. Revenue MetricsUnderstanding the difference between vanity metrics and revenue metrics is essential for making better monetization decisions.Metric TypeExampleWhat It Really Tells YouWhy It's MisleadingVanity MetricHigh CPMWhat an advertiser agrees to payIgnores fill rate, viewability, and demand diversityVanity MetricTotal ImpressionsHow many ads were servedDoesn't tell you if they were seen or valuableRevenue MetricEffective RPMActual revenue per 1,000 requestsCombines CPM and fill rate into one meaningful numberRevenue MetricRevenue Per Session (RPS)Revenue per actual user visitMeasures real monetization performanceRevenue MetricViewable RPMRevenue per 1,000 viewable impressionsWhat advertisers actually valueFuture Outlook: The End of Vanity MetricsThe industry is moving decisively away from vanity metrics and toward outcome-based optimization. Several trends are accelerating this shift.Privacy regulations are making audience targeting more complex. Publishers who rely on high CPMs from targeted inventory are vulnerable. Those who build diversified demand and high fill rates are more resilient.AI and automation are making it easier to optimize for effective RPM. Machine learning models can balance fill rate and CPM in real time, finding the optimal floor price and demand routing for each impression.Advertiser sophistication is increasing. Brands are demanding more transparency and better performance metrics. They are increasingly rewarding publishers who can demonstrate strong effective RPM and viewability.Unified measurement is becoming the standard. Publishers are moving away from fragmented dashboards and toward unified platforms that show the complete picture—fill rate, CPM, effective RPM, and revenue per session, all in one place.The publishers who embrace this shift will thrive. Those who cling to vanity metrics will struggle.The highest CPM doesn't always win. It rarely does. The publishers who consistently earn the most revenue are not the ones with the highest headline numbers. They are the ones who optimize for the complete picture—fill rate, demand diversity, viewability, and user experience.Stop chasing the dashboard's prettiest number. Start optimizing for revenue outcome. Effective RPM is the metric that matters. It is the number that tells you what you actually earn, not what you could earn if everything went perfectly.Adstork helps publishers escape the high CPM trap. Our platform provides transparent reporting, multi-SSP demand, and optimization tools that let you focus on effective RPM, not vanity metrics. Sign up for a free Adstork publisher account and get a complimentary revenue audit that shows you exactly where your optimization opportunities are.Your immediate action plan: Pull your last 30 days of reporting and calculate your effective RPM for each demand partner and ad unit. Compare it to your headline CPM. Identify where the gap is largest—is it fill rate, viewability, or something else? Focus on fixing that gap. Share your results with Adstork's optimization team for a personalised revenue growth plan.Frequently Asked QuestionsWhy doesn't the highest CPM always win? Because CPM is only half the equation. A high CPM with low fill rate generates less revenue than a moderate CPM with high fill. Effective RPM—the combination of CPM and fill rate is the metric that actually matters.What should publishers optimize instead of CPM? Optimize for effective RPM (revenue per 1,000 requests), fill rate, demand diversity, viewability, and user experience. These factors together determine your actual revenue outcome.What is effective RPM? Effective RPM is calculated as CPM × Fill Rate. It shows your actual earnings per 1,000 ad requests, combining the price you receive with the percentage of inventory that actually fills.How do I increase effective RPM? Improve fill rate by adding demand partners, adjust floor prices to balance fill and CPM, improve viewability, diversify ad formats, and optimize page speed and user experience. Each of these factors contributes to higher effective RPM.What is the difference between CPM and eCPM? CPM is what an advertiser agrees to pay. eCPM is what a publisher actually earns after accounting for fill rate, revenue share, and other factors. eCPM is the more accurate measure of publisher revenue.Why do publishers chase high CPMs if they don't always win? Because high CPMs are visible and ego-boosting. They appeal to salience bias the tendency to focus on the most noticeable number. Publishers who overcome this bias and focus on effective RPM consistently outperform those who chase vanity metrics.
Read More
-
24 Aug, 2026
Why Are Advertisers Bidding Less on Your Inventory?
You have done everything right. Your traffic is growing. Your content is solid. Your ad setup is technically sound. But your CPMs are flat or falling. Advertisers are just not bidding what they used to.The problem is not your setup. It is your signal.Advertisers do not bid on traffic. They bid on audiences. They bid on the value they expect to extract from each impression. When your CPMs drop, it is because the perceived value of your inventory has dropped. Your audience, placement, format, or context is sending a signal that reduces advertiser confidence.The publisher-side metrics:- fill rate, eCPM, effective RPM are symptoms. The demand-side factors are the root causes. Understanding why advertisers bid less is the first step to fixing what is broken.This guide explains the eight demand-side factors that determine advertiser bids and what you can do about each one.Key TakeawaysAdvertisers bid on perceived audience value, not just traffic volume—low engagement means lower bids.Geographic demand varies dramatically—tier-1 traffic earns 3-5x more than tier-3 traffic.Desktop and mobile demand differ—optimise for your strongest device mix.Viewability below 70% significantly reduces advertiser bids.Brand safety concerns can cut CPMs by 50% or more.Weak demand competition means lower bids—header bidding with 3-5 partners lifts CPMs by 20-40%.1. Audience ValueThis is the most important factor. Advertisers bid based on the value they expect to extract from an audience. High-value audiences those with strong purchasing power, clear intent, and active engagement command premium CPMs.What signals high audience value? Deep engagement matters—long session durations, multiple pages per visit, and return visits. Purchase intent is critical—commercial keywords, product research, and buying signals. Demographic quality counts—affluent, educated, and decision-making audiences. Audience loyalty is powerful—subscribers, registered users, and repeat visitors.Advertisers are sophisticated. They analyse engagement patterns and adjust bids accordingly. A visitor who reads one article and bounces is worth far less than a visitor who explores multiple pages, comments, and returns.A finance site with engaged subscribers and premium content might command $15-30 CPM. A general news site with passive readers might earn $2-5 CPM. The traffic numbers might be similar. The audience value is not.Neuromarketing insight: advertisers are not buying impressions. They are buying attention, trust, and action. An engaged audience signals all three. Passive traffic signals none. Publishers who build genuine audience relationships consistently outperform those who chase volume.Fix: Build deeper audience relationships through quality content, community engagement, and email capture. Segment your audience and offer premium, engaged cohorts to advertisers.2. GeographyGeography is the most structural factor affecting advertiser bids. Demand and pricing vary dramatically by country.Tier-1 countries - United States, United Kingdom, Canada, Australia, Western Europe command the highest CPMs. Advertiser budgets are largest, competition is fiercest, and audience purchasing power is strongest. Tier-2 countries - Eastern Europe, Latin America, parts of Asia have lower demand and lower CPMs. Tier-3 countries - Africa, South Asia, parts of Southeast Asia have the lowest demand and CPMs.The difference is dramatic. US traffic might earn $5-10 CPM. Indian traffic might earn $0.50-1.50. The volume might be similar. The revenue is not.Geography also affects fill rate. Tier-1 traffic enjoys fill rates above 85%. Tier-3 traffic often struggles below 60%. The combination of lower CPMs and lower fill rates creates a revenue gap that can be 5-10x.Fix: Accept that geography sets a ceiling on your CPMs. Focus on growing traffic from high-value geos. Add demand partners with strong regional coverage. Consider content strategies that appeal to premium markets.3. DeviceDevice type is a significant factor in advertiser bidding. Desktop, mobile web, and mobile app traffic each have different demand profiles and CPMs.Desktop traffic typically commands higher CPMs than mobile web. Larger screens, more browsing time, and higher purchase intent drive stronger demand. Mobile app traffic especially in premium categories like gaming and entertainment can command high CPMs, often exceeding desktop. Mobile web traffic usually earns the lowest CPMs of the three.The gap is significant. Desktop CPMs might be 2-3x higher than mobile web for the same audience and geography. Some publishers have seen desktop CPMs 4-5x higher than mobile.Device also affects user behaviour. Mobile users are often in browsing mode scrolling quickly, consuming content in short bursts. Desktop users are more likely to be in research or purchase mode, spending longer on pages and engaging more deeply with content.Fix: Optimise your site for the devices where you earn the most. If desktop traffic earns 3x more than mobile, ensure your desktop experience is flawless. Consider app development if your mobile traffic is strong and CPMs justify the investment.4. Ad FormatThe format you use sends a signal to advertisers. Some formats are premium. Others are commoditised.Video ads command the highest CPMs often $10-25 or more. Native ads typically earn $3-15, depending on placement and audience. Standard display ads earn $1-8, with larger and more viewable units earning more. Popunders and interstitials vary widely, with popunders often earning $2-8 and interstitials $1-5.The format also affects advertiser perception. Video is seen as high engagement and high value. Native is seen as less intrusive and more effective. Display is seen as baseline inventory. Popunders and interstitials are seen as lower quality, even when they perform.Format suitability also matters. A news site with native recommendations might see strong CPMs. A gaming site with interstitials might see better performance. Using the wrong format for your audience reduces bids.Fix: Test different formats to find what works best for your audience and content. Prioritize premium formats like video and native where possible. Ensure your display placements are high quality and viewable.5. Traffic QualityAdvertisers are increasingly sophisticated about traffic quality. They use sophisticated fraud detection, viewability measurement, and engagement analysis to filter low-quality inventory.What signals low traffic quality? High bounce rates (80%+) signal users who leave immediately. Short session durations (under 60 seconds) indicate low engagement. Suspicious referral sources suggest incentivized or low-quality traffic. Sudden traffic spikes indicate potential bot activity. Low pages per session (1-2) signal superficial engagement.Advertisers often filter or reduce bids on low-quality inventory. The CPM difference between high-quality and low-quality traffic can be 2-5x.Low-quality traffic also affects your long-term reputation. If advertisers consistently see poor performance from your inventory, they will reduce bids or exclude you entirely.Fix: Audit your traffic sources regularly. Cut sources that drive low-quality traffic. Focus on building high-engagement audiences through quality content and legitimate acquisition channels.6. ViewabilityViewability is the percentage of impressions that are actually seen by users. It is one of the strongest signals of inventory quality. Advertisers increasingly refuse to pay for inventory that is not viewable.The industry standard for viewability is 50% of pixels visible for at least one second (display) or two seconds (video). Inventory that meets these standards commands premium CPMs. Inventory that does not is discounted or filtered.Publishers with viewability above 70% see stronger bids. Those above 80% see premium treatment. Below 50%, advertisers often reduce bids or filter entirely.Viewability also affects demand competition. More bidders compete for viewable inventory, driving CPMs higher. Less viewable inventory faces limited competition and lower bids.Fix: Optimize ad placement to maximize viewability. Move ads above the fold. Ensure they load quickly. Avoid placing ads at the bottom of long articles where users rarely scroll. Test different placements and measure viewability.7. Brand SafetyBrand safety concerns can significantly reduce advertiser bids. Advertisers want their ads to appear in safe, reputable environments. Unsafe or questionable inventory is discounted or avoided.What signals brand safety concerns? Controversial or sensitive content, politics, violence, adult content. User-generated content with minimal moderation. Low-quality or spammy content. Piracy or copyright infringement. Misinformation or factually questionable content.Many advertisers use brand safety filters that exclude inventory flagged as unsafe. Other advertisers simply bid less on inventory they perceive as risky.The CPM impact of brand safety concerns can be dramatic. A brand-safe site might earn $8 CPM. A questionable site might earn $2-3 CPM. The traffic volume might be similar. The revenue is not.Fix: Ensure your content is brand-safe and clearly categorized. Use content classification tools to signal your content type to advertisers. Avoid controversial or low-quality content that might trigger filters.8. Demand CompetitionThis is the structural factor that publishers can most directly influence. Demand competition is the number and quality of bidders competing for your inventory.If only one demand partner is bidding on your inventory, there is no competition. The bid will be low. If five demand partners are bidding, competition drives the bid higher. This is the core principle of header bidding.Publishers using header bidding with 3-5 SSPs see 20-40% CPM uplifts compared to single-source setups. More partners mean more competition, which means higher bids.Demand competition also affects fill rates. If one partner does not bid on a particular impression, another might. More partners mean higher fill rates and more consistent revenue.Fix: Implement header bidding with multiple SSPs. Add complementary demand partners that bring different demand sources, geographies, and format coverage. Test new partners regularly to ensure you are not leaving demand on the table.Improving advertiser bids requires addressing these eight factors. Adstork connects publishers to multiple premium demand sources through a unified header bidding platform, increasing demand competition and driving higher bids. Our reporting shows you exactly which factors are affecting your CPMs, audience value, viewability, traffic quality, and more so you can take targeted action. Explore Adstork's publisher solutions and see how better demand competition transforms your CPMs.Industry Insight: The Bid GapAnalysis across publisher sites reveals a significant bid gap between well-optimized and poorly-optimized inventory.Publishers who address all eight factors high audience value, tier-1 geography, optimized device mix, premium formats, clean traffic, strong viewability, brand-safe content, and competitive demand see CPMs 3-5x higher than those who ignore them.The gap is widest in viewability and demand competition. Publishers with viewability above 70% see 40-60% higher CPMs than those below 50%. Publishers with 3-5 SSPs see 20-40% higher CPMs than single-source setups.The data is clear. Advertisers are sophisticated. They know what they are buying. They reward quality and penalize low value. Publishers who address these factors capture the premium. Those who ignore them leave money on the table.Comparison Table: Factors Affecting Advertiser BidsA quick reference guide to the eight factors and how they affect advertiser bids.FactorHigh Bid SignalsLow Bid SignalsAudience ValueDeep engagement, purchase intent, loyaltyHigh bounce rates, passive consumptionGeographyUS, UK, Canada, Australia, Western EuropeAfrica, South Asia, Southeast AsiaDeviceDesktop, premium mobile appsMobile web, low-quality appsAd FormatVideo, native, premium displayPopunders, interstitials, standard displayTraffic QualityOrganic, direct, email, clean referralsIncentivised, suspicious, bot-heavyViewabilityAbove 70%Below 50%Brand SafetyHigh-quality, trusted contentControversial, low-quality contentDemand Competition3-5 SSPs, header biddingSingle SSP, waterfallFuture Outlook: The Demand Side in 2026 and BeyondThe advertiser side is evolving rapidly. Several trends will affect how advertisers bid on inventory in the coming years.Cookie deprecation is shifting advertiser focus to contextual and first-party signals. Publishers with strong contextual relevance and first-party data will see stronger bids. Those without will see weaker demand.AI-powered bidding is making advertiser decisions more sophisticated. Machine learning models analyze thousands of signals in milliseconds, adjusting bids based on expected value. Publishers who optimize for the right signals will capture higher bids.Brand safety requirements are becoming stricter. Advertisers are demanding more transparency and control. Publishers who cannot demonstrate brand safety will see reduced demand.Attention metrics are emerging. Advertisers are moving beyond viewability to measure attention and engagement. Publishers who can demonstrate genuine attention will command premium CPMs.The publishers who succeed will be those who understand the demand side and optimize for it. Those who focus only on publisher-side metrics will struggle.Advertisers bid less on your inventory for eight clear reasons: low audience value, unfavorable geography, poor device mix, unsuitable formats, low traffic quality, poor viewability, brand safety concerns, and weak demand competition.Each factor sends a signal to advertisers about the value of your inventory. Publishers who address these factors see CPMs rise. Those who ignore them see CPMs fall.Understanding the demand side is essential for long-term revenue growth. Publisher-side metrics like fill rate and eCPM are symptoms. The demand-side factors are the root causes.Adstork helps publishers address the demand side through multiple premium demand sources, transparent reporting, and optimization tools. Our platform connects your inventory to more bidders, increasing competition and driving higher bids. Sign up for a free Adstork publisher account and get a complimentary demand-side audit that shows you exactly where advertisers are bidding less and how to fix it.Your immediate action plan: Audit your inventory from the advertiser's perspective. Check your audience engagement, geographic mix, device split, format selection, traffic quality, viewability, brand safety, and demand competition. Identify the weakest factor and address it. Test the impact over two weeks. Share your results with Adstork's optimization team for a personalized demand-side improvement plan.FAQsWhy are advertisers bidding less on my inventory? Advertisers bid less for eight key reasons: low audience value, unfavorable geography, poor device mix, unsuitable formats, low traffic quality, poor viewability, brand safety concerns, and weak demand competition. Each factor reduces the perceived value of your inventory.How can I increase advertiser bids? Address the factors that reduce bids—build deeper audience engagement, attract high-value geos, optimise for desktop and premium devices, use premium formats, clean your traffic sources, improve viewability, ensure brand safety, and add demand partners to increase competition.Does traffic quality affect CPM? Yes, significantly. High-quality traffic with strong engagement commands 2-5x higher CPMs than low-quality traffic. Advertisers use sophisticated tools to filter low-quality inventory and reduce bids accordingly.How does viewability affect advertiser bids? Viewability is one of the strongest signals of inventory quality. Inventory with viewability above 70% commands premium CPMs. Inventory below 50% is often discounted or filtered. Advertisers increasingly refuse to pay for inventory that is not viewable.What is brand safety and why does it affect bids? Brand safety refers to the suitability of an environment for advertiser brands. Advertisers want their ads to appear in safe, reputable environments. Unsafe or questionable inventory is discounted or avoided, often with CPM reductions of 50% or more.How does demand competition affect CPMs? More demand partners mean more competition, which drives higher bids. Publishers using header bidding with 3-5 SSPs see 20-40% CPM uplifts compared to single-source setups. Weak demand competition is a major factor in low CPMs.
Read More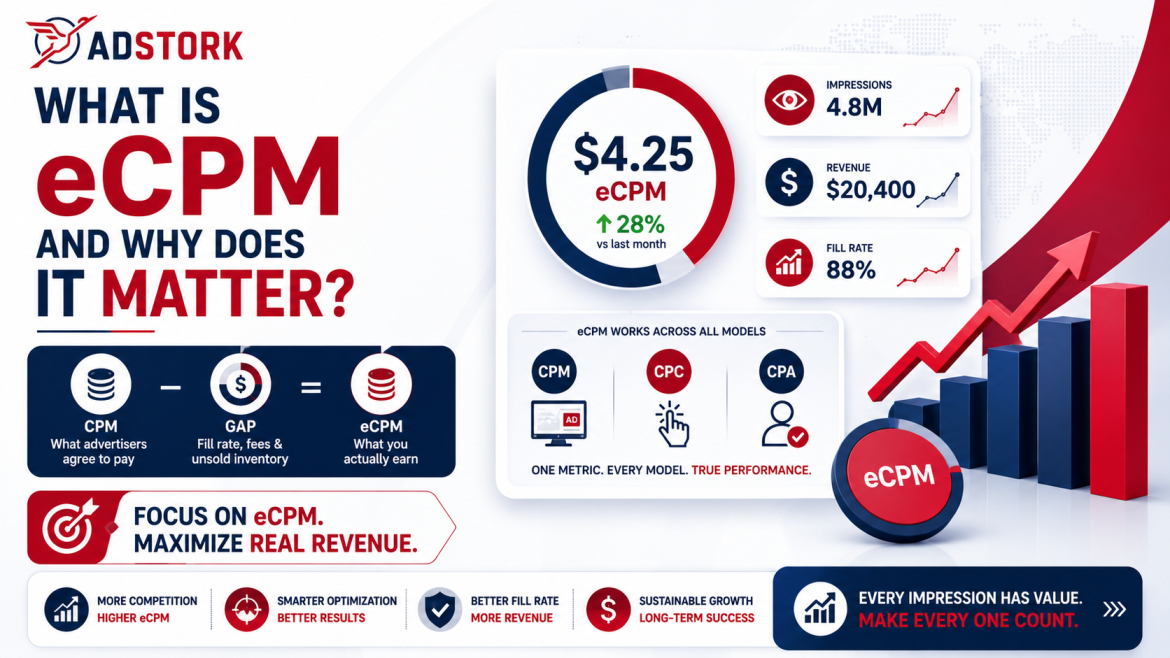
-
20 Aug, 2026
What Is eCPM and Why Does It Matter?
Your dashboard shows a $10 CPM. You feel good. Then your revenue report arrives, and the numbers do not match your expectations. What happened?You were looking at the wrong number.CPM tells you what an advertiser agrees to pay. eCPM tells you what you actually earn. The gap between these two numbers reveals everything about your monetisation health—fill rate gaps, revenue share leaks, and demand partner performance. Publishers who track eCPM instead of CPM make smarter decisions, capture more revenue, and build more sustainable businesses.This guide explains what eCPM is, how to calculate it, why it matters more than CPM, and actionable strategies to improve yours in 2026.Key TakeawayseCPM (effective cost per mille) is your actual revenue per 1,000 impressions—calculated as (Total Revenue ÷ Total Impressions) × 1,000.CPM is what advertisers pay; eCPM is what publishers earn. The gap reveals fill rate issues, revenue share, and unsold inventory.A $1.00 eCPM increase can drive 25-40% annual revenue growth without additional traffic.Good display eCPM in 2026: $3–$8 for US desktop, $1.50–$5 for US mobile.eCPM works across all pricing models—CPM, CPC, and CPA—giving you one number to compare everything.What Is eCPM?eCPM stands for effective cost per mille. "Mille" is Latin for thousand, so eCPM measures your effective revenue per 1,000 ad impressions. It is a publisher-side metric that calculates how much money you actually earn for every thousand times an ad is served on your site.The key word is "effective." Unlike CPM, which is a negotiated rate between an advertiser and a publisher, eCPM reflects what you actually take home after everything that happens in the auction—fill rate, revenue share, unsold inventory, and the performance of different pricing models.eCPM is not limited to CPM campaigns. It works across every pricing model—CPC (cost per click), CPA (cost per acquisition), and CPM. This makes it the only metric that lets you compare performance across different ad types, demand partners, and pricing structures on equal terms.Neuromarketing insight: the human brain fixates on the number that looks best—the high CPM. But that number is a promise, not a reality. eCPM forces you to confront what you actually earn. This shift from "what could be" to "what is" changes how you optimise. Publishers who embrace this reality consistently outperform those who chase vanity metrics.The eCPM FormulaThe calculation is straightforward:eCPM = (Total Ad Revenue ÷ Total Impressions) × 1,000Example 1: Basic CalculationYour site earned $450 from 200,000 impressions yesterday.eCPM = ($450 ÷ 200,000) × 1,000 = $2.25You earned $2.25 for every 1,000 impressions served.Example 2: Comparing Two Ad UnitsYour sidebar 300x250 earned $180 from 80,000 impressions. Your in-content 728x90 earned $120 from 90,000 impressions.Sidebar eCPM: ($180 ÷ 80,000) × 1,000 = $2.25In-content eCPM: ($120 ÷ 90,000) × 1,000 = $1.33The sidebar unit outperforms the in-content unit by 69%. This tells you to investigate why—is the sidebar more viewable? Does it attract better demand?eCPM vs. CPM: The Difference That MattersThe distinction between eCPM and CPM is the single most important metric difference for publishers to understand.CPM (cost per mille) is an advertiser-side metric. It is the price an advertiser agrees to pay for 1,000 impressions of their ad. When a brand says "we are running a $10 CPM campaign," they mean they will pay $10 for every thousand times their ad is shown. CPM is a planning and budgeting unit for advertisers.eCPM (effective cost per mille) is a publisher-side metric. It is the revenue you actually earn per 1,000 impressions served—across all impressions, including the ones that did not fill, the ones that cleared at lower prices, and the ones where revenue share was applied.The gap between CPM and eCPM tells a story. If your CPM is $10 but your eCPM is $4, you are losing $6 per 1,000 impressions to fill gaps, revenue share, or auction dynamics. That gap is your opportunity.Here is a real-world example: Publisher A runs a campaign with a $10 CPM but only fills 40% of ad requests. Publisher B runs a $5 CPM campaign with a 90% fill rate. Publisher A earns $4 eCPM ($10 × 40%). Publisher B earns $4.50 eCPM ($5 × 90%). The lower CPM generates more revenue. eCPM makes this discrepancy visible immediately.eCPM vs. RPM: Another Important DistinctionRPM (revenue per mille) is often confused with eCPM. The distinction is subtle but important.eCPM measures revenue per 1,000 ad impressions served. It is an impression-level metric.RPM measures revenue per 1,000 page views or sessions. It accounts for fill rate, ad density, and everything else that happens between a user visiting your site and an ad successfully loading.Two publishers can have identical eCPMs but very different RPMs if one runs three ads per page and the other runs one. RPM captures how your monetisation setup performs for real users in real sessions. RPM is better for business planning and revenue forecasting. eCPM is better for comparing ad units, demand partners, and auction performance.Industry Insight: eCPM Benchmarks and Trends in 2026What is a good eCPM in 2026? The answer depends on your geography, format, and audience quality. But here are the benchmarks that matter.Display eCPM benchmarks (2026):• US desktop traffic: $3 – $8• US mobile traffic: $1.50 – $5• Top-tier financial/crypto publishers: $8 – $15+ display, $20 – $30+ video• UK programmatic average (Q1 2026): £1.30Ad format differences: Video ads typically command $10–$25 eCPM, compared to $1–$3 for standard display. Rewarded video has stabilised in the high single digits to low double digits globally, with premium markets consistently outperforming.Geographic differences: The United States, United Kingdom, Australia, Canada, and Western Europe consistently deliver the highest eCPMs across all formats. A good eCPM for US traffic may vary from $5 to $10, while $0.50 may be good enough for India.2026 trends: The ad supply crunch is reshaping eCPM. In June 2026, ad supply fell roughly 40% year on year across the UK and US. UK eCPMs rose around 30%, while US eCPMs rose about 7%. Publishers who package and signal their inventory clearly are capturing this value.Tracking eCPM is only half the battle—improving it requires the right infrastructure. Adstork connects publishers to multiple premium demand sources through a unified header bidding platform, driving real-time competition that consistently lifts eCPM. Publishers on multi-SSP setups typically see 20-40% eCPM uplifts compared to single-source or waterfall configurations. Explore Adstork's publisher solutions and see how better demand competition can transform your eCPM.Why eCPM Is the Most Important Publisher MetriceCPM matters because it gives you one number that captures your entire monetisation performance. Here is why it is the metric you should track above all others.It normalises across pricing models. Without eCPM, you cannot compare a CPC campaign against a CPM campaign. With eCPM, you can. If Partner A pays $4 CPM, Partner B pays $0.25 CPC with 0.8% CTR, and Partner C pays $5 CPA with 0.3% conversion rate, eCPM reveals Partner A as the winner at $4.00, Partner B at $2.00, and Partner C at $1.50.It reveals fill rate problems. A high CPM with low fill generates less revenue than a moderate CPM with high fill. eCPM captures this trade-off immediately.It enables accurate partner evaluation. eCPM lets you compare SSP A against SSP B on equal terms, regardless of their pricing models.It drives revenue growth. According to industry observations, publishers who increase eCPM by $1.00 while maintaining fill rate often see 25-40% yearly revenue growth—not from more traffic, but from better monetisation.Comparison Table: CPM vs. eCPM vs. RPMUnderstanding the differences between these three metrics is essential for making informed decisions about your monetisation strategy.MetricWho Uses ItWhat It MeasuresFormulaCPMAdvertisersPrice paid per 1,000 impressionsNegotiated rateeCPMPublishers (slot-level)Actual revenue per 1,000 impressions served(Revenue ÷ Impressions) × 1,000RPMPublishers (site-level)Revenue per 1,000 page views or sessions(Revenue ÷ Pageviews) × 1,000How to Improve Your eCPMImproving eCPM is about capturing more value from your existing traffic. Here are the most effective strategies in 2026.1. Implement header bidding. Header bidding creates real-time competition among multiple SSPs for every impression. Publishers on multi-SSP header bidding platforms have achieved 20-40% eCPM uplifts compared to single-source or waterfall setups.2. Use dynamic floor pricing. Static floor prices can erode CPMs by 20-30% across device and geo segments. Dynamic floors, adjusted via real-time yield data, balance fill rates and eCPM to capture 15%+ RPM uplift without traffic growth.3. Optimise viewability. Higher viewability attracts better demand. Above 80% viewability, buyers stop differentiating on viewability scores and start differentiating on fill rate, inventory volume, and audience quality.4. Diversify demand sources. Better demand leads to higher bids. More competition leads to better auctions. Better user experience leads to better performance. In 2026, the gap between average and high-performing inventory is widening.5. Optimise Core Web Vitals. Publishers who systematically optimise Core Web Vitals alongside header bidding and floor pricing consistently see 20-40% yield improvements.6. Use higher-value formats. Video ads typically command $10-$25 eCPM compared to $1-$3 for display. Native ads can have 200% higher CPMs than standard banner ads.Future Outlook: eCPM in 2026 and BeyondSeveral trends are shaping the future of eCPM for publishers.AI-powered pricing intelligence is giving publishers a new advantage. When implemented correctly, AI-driven floors maximise the multiplication of CPM and fill rate rather than optimising either in isolation.Privacy regulations are creating eCPM differentials. With Apple ATT and Android Privacy Sandbox, unconsented traffic can earn 20-40% lower eCPMs due to limited targeting signals. Apps that implement clear value-exchange consent flows see 15-35% eCPM uplift.Supply scarcity is driving eCPM growth. As ad supply declines and audiences fragment, the price per impression is holding or rising. Publishers who package and signal their inventory clearly will capture this value.Attention-based metrics are emerging. Publishers are shifting from optimising for fill rate to optimising for attention. Fewer ads, better placements, and stronger outcomes are driving yield growth without adding more ads.eCPM is not just another acronym. It is the single most important metric for understanding your actual ad revenue performance. CPM tells you what could be. eCPM tells you what is. The publishers who track eCPM, optimise for it, and build their monetisation strategy around it consistently outperform those who chase vanity metrics.If you are ready to move beyond CPM and start optimising for what you actually earn, Adstork provides the infrastructure you need. Our unified platform connects you to multiple premium demand sources, delivers transparent reporting that shows your true eCPM across every placement, and helps you identify exactly where you are leaving revenue on the table. Sign up for a free Adstork publisher account and get a complimentary eCPM audit that shows you where your biggest opportunities are.Your immediate action plan: Pull your last 30 days of reporting and calculate your eCPM for each ad unit, demand partner, and placement. Compare your eCPM against industry benchmarks. Identify your lowest-performing segments and investigate why—is it fill rate, viewability, or demand quality? Test one improvement (like adding a header bidding partner or adjusting floor prices) and measure the impact on eCPM over two weeks. Share your results with Adstork's optimisation team for a personalised improvement plan.FAQsWhat is eCPM in simple terms? eCPM (effective cost per mille) is the revenue a publisher actually earns for every 1,000 ad impressions. It is calculated as (Total Revenue ÷ Total Impressions) × 1,000.What is the difference between eCPM and CPM? CPM is what an advertiser agrees to pay per 1,000 impressions. eCPM is what a publisher actually earns per 1,000 impressions after accounting for fill rate, revenue share, and unsold inventory.What is a good eCPM for publishers in 2026? A good display eCPM is $3–$8 for US desktop traffic and $1.50–$5 for US mobile traffic. Premium financial and crypto publishers can achieve $8–$15+ for display and $20–$30+ for video.How do I calculate eCPM? Use the formula: eCPM = (Total Ad Revenue ÷ Total Impressions) × 1,000. For example, if you earned $450 from 200,000 impressions, your eCPM is $2.25.Why does eCPM matter more than CPM for publishers? eCPM captures your actual earnings across all pricing models and fill rates. CPM only shows what an advertiser agrees to pay. A high CPM with low fill often earns less than a moderate CPM with high fill. eCPM reveals this discrepancy immediately.What factors affect eCPM? eCPM is affected by geography (premium markets like US, UK, Australia deliver higher eCPMs), ad format (video and native outperform display), device (desktop vs. mobile), viewability, fill rate, demand partner quality, and user engagement.How can I increase my eCPM? Implement header bidding to create competition, use dynamic floor pricing, optimise viewability, diversify demand sources, improve Core Web Vitals, and use higher-value formats like video and native.
Read More